Date: November 22, 2022
In football’s English Premier League (EPL), one of the most important matches every season is the Merseyside “derby’’ between two neighbouring clubs – Liverpool and Everton. These clubs are bitter rivals that occupy the same city, with incredibly passionate fans that hate to lose the derby.

Now suppose that Liverpool has won the past five derbies. Would you then assume that if the two clubs are meeting tomorrow, Liverpool is going to make it six in a row?
Maybe it will, but then as some people say, “the ball is round’’, meaning that football is an unpredictable game, and anything can happen. Now let’s assume that instead of having won the past five derbies, Liverpool has won the past ten. Would this make a difference?
Using technical analysis in investing is a bit like trying to predict the outcome of football matches using past performance. If one team has consistently beaten another, then it’s natural to believe that it will do it again the next time they meet.
Some people though, might argue that much depends on the players, the coach, the tactics and the preparation for the game. In other words, some football analysts might prefer to look at the team’s fundamentals rather than rely on just a past track record.
The same thinking applies when it comes to technical analysis and the alternative, which is known as fundamental analysis.
The Cambridge Dictionary defines Technical Analysis (TA) as:
“a method used to calculate the future value of shares by studying the patterns of their past behaviour rather than the fundamentals’’.
Investopedia defines TA as:
“a trading discipline employed to evaluate investments and identify trading opportunities in price trends and patterns seen on charts’’.
It can be seen from the above definitions that TA seeks to capitalise on identifiable patterns in past price movements of various assets like stocks and currencies using charts to figure out how prices might move in future, the logic being that if the charts indicate a future move in a particular direction, then it makes sense now to position oneself accordingly.
TA vs Fundamental Analysis
As mentioned earlier in the football analogy, some football pundits might prefer to ignore past performance and look at the fundamentals of each team – injuries to players, each team’s form in the run-up to the game, the likely tactics to be employed, etc.
In finance, fundamental analysis is a method of evaluating an asset that involves attempting to measure its intrinsic value by examining related economic, financial and other qualitative and quantitative factors.
Fundamental analysts attempt to study everything that can affect the asset’s value, including macroeconomic factors (like the overall economy and industry conditions) and company-specific factors (like financial condition and management).
TA on the other hand, does not attempt to measure a security’s intrinsic value, but instead use charts and other tools to identify patterns that can suggest future activity.
Does all of this mean that one is better than the other? No – although it is important to have an understanding of TA, you must also be aware of a company’s financial strength by studying its annual reports and financial statements.
Also, like football matches, stock markets can often behave unpredictably and throw up unexpected outcomes, so charts may not accurately show the company’s value. Knowing how to perform both fundamental and TA is therefore essential for both investors and traders.
The 4 Basic Principles of TA
There are many principles on which TA is built. Here are some of the more important:
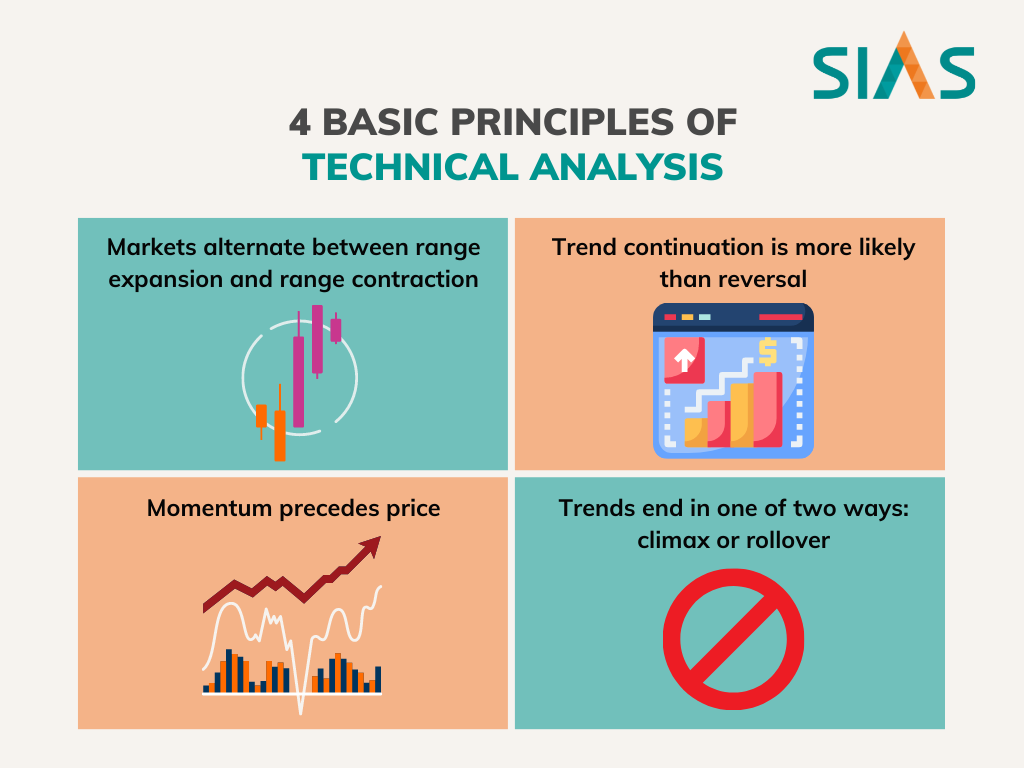
- Markets alternate between range expansion and range contraction. This principle is based on the idea that prices tend to trade in ranges and it’s important to identify what the present range might be and what the next range will be.
- Trend continuation is more likely than reversal.
This principle is based on the saying “the trend is your friend…until it bends’’. In other words, if the market is trending in a particular direction, then your best bet is to assume that direction will continue for the time being. Of course, it’s important to also identify when the trend might be about to reverse. - Trends end in one of two ways: climax or rollover
A trend which ends in a buying climax is one where the last buyers are willing to pay practically any price. Once that last buyer buys, a vacuum is created on the other side and the market collapses.On the other hand, a trend rollover is when the buying or selling simply runs out of steam and peters out. - Momentum precedes price
The meaning of this rule is that when a market makes a sharp move (an “impulse” or “momentum” move), price is likely to continue further in the same direction.
Some Common TA Terms and Indicators
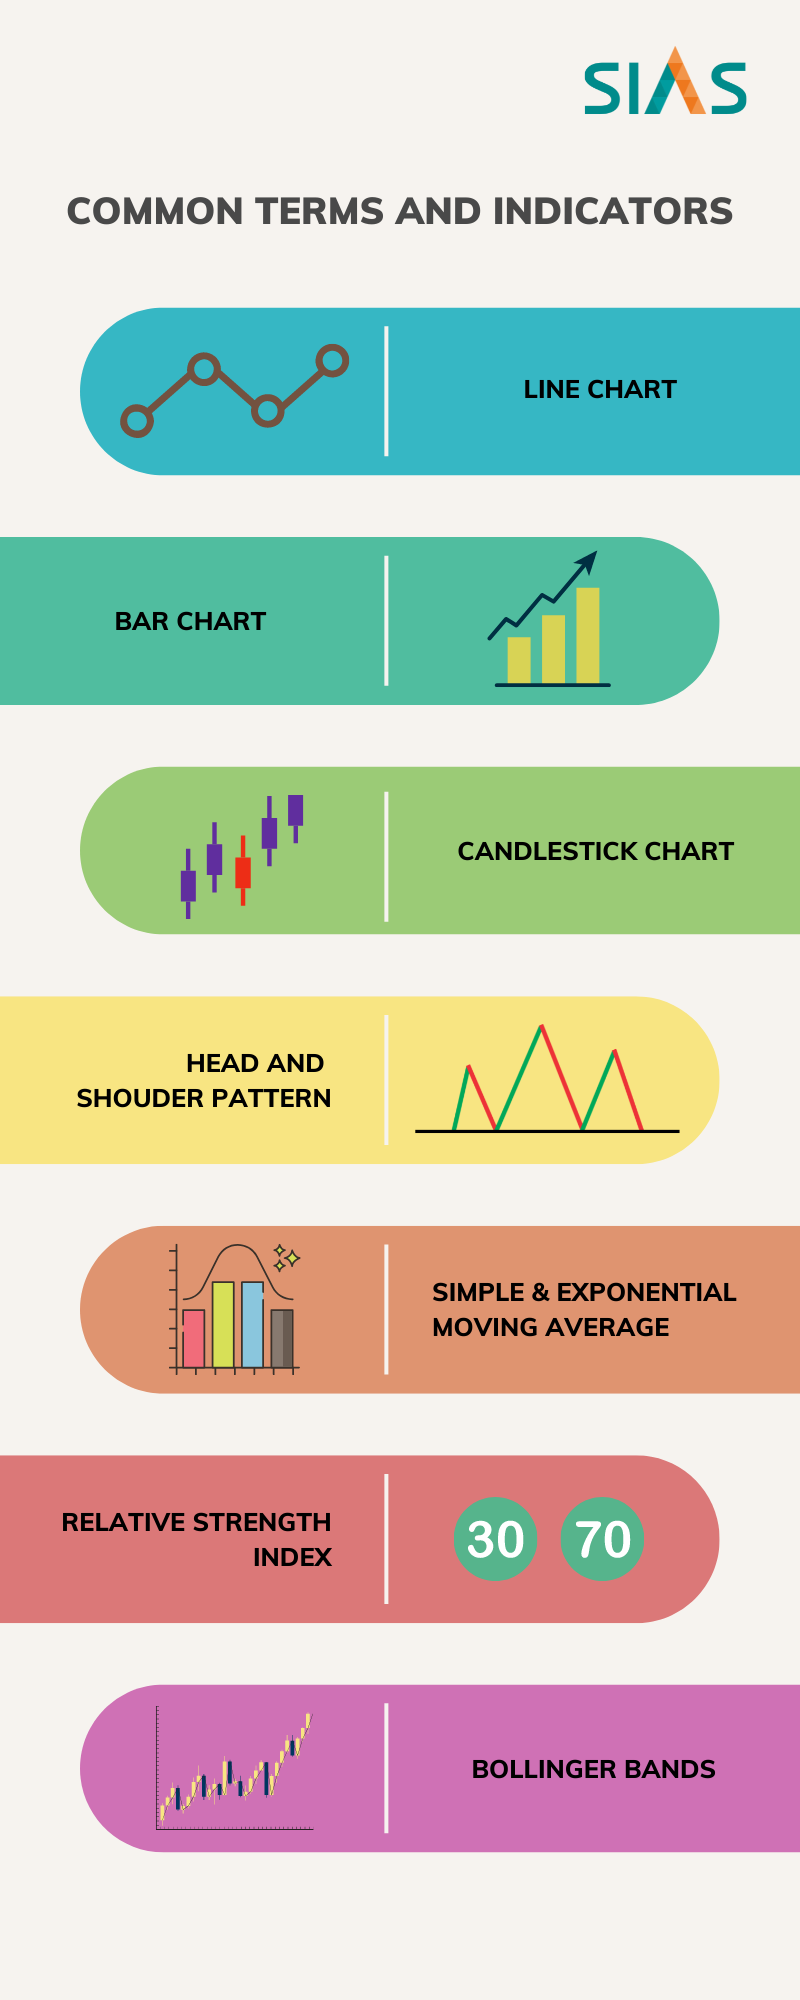
Line chart – A single line that connects stock prices is called a line chart.
Bar chart – A chart that has open, high, low, and closing data sets in a vertical line in the form of a bar. It’s also referred to as an open-high-low-close chart.
Candlestick charts show four price points (open, close, high, and low) throughout the period of time the trader specifies. The advantage of candlestick charts is the ability to highlight trend weakness and reversal signals that may not be apparent on a normal bar chart. Candlestick charts serve as a cornerstone of technical analysis.
Head and Shoulder Pattern – A reversal pattern that is one of the more common and reliable indications. A normal head-and-shoulder pattern is a bearish signal whilst an inverted pattern is bullish.
Simple moving average (SMA) and exponential moving average (EMA) are two types of moving averages that can help you figure future market patterns.
You can calculate simple moving average by adding the closing price of a company stock and then dividing it by the number of days. So, if you want to calculate a 50-day SMA, you will have to add the closing price of the stock for the last 50 days and then divide it by 50. You can similarly calculate a 100-day or a 200-day SMA.
EMA, on the other hand, gives more importance to recent trading data. This is why EMA is better at spotting price changes vis-a-vis SMA. Therefore, it is the moving average of choice for most traders.
The difference between 26-day EMA and 12-day EMA gives us the moving average convergence and divergence (MACD). This is used to determine overbought or oversold conditions. A negative MACD indicates that the stock price is likely to decline, while a positive MACD implies that the stock price may go up in the short-term.
The Relative Strength Index (RSI) is a momentum indicator that measures the speed and change of price movements. The RSI oscillates between zero and 100. Traditionally the RSI is considered overbought when above 70 and oversold when below 30. Signals can be generated by looking for divergences and failure swings. RSI can also be used to identify the general trend.
Bollinger Bands plot trading bands above and below a simple moving average. The standard deviation of closing prices for a period equal to the moving average employed is used to determine the band width. This causes the bands to tighten in quiet markets and loosen in volatile markets. The bands can be used to determine overbought and oversold levels, locate reversal areas, project targets for market moves, and determine appropriate stop levels.
Advantages offered by TA
When analysing charts, you are placing more importance on herd psychology (the market) than on the valuation of a publicly traded company. In fact, this is one of the advantages of technical analysis. To properly read the chart, you don’t need to have any particular knowledge of economics, finance or accounting.
TA tasks can be automated which saves time. This means a technical analyst can cover more stocks and draw ideas from a larger universe.
Also note that in the short term, price action is affected by several factors that fundamental analysis cannot pick up. The effects of market sentiment, market psychology, and supply and demand can all be observed by looking at a chart. Technical analysis can therefore be used to improve timing, and to trade strategies appropriate to market conditions.
However, it is important to know that TA is not foolproof, and there’s no guarantee that past patterns will repeat themselves in future. For example, technical indicators may signal a strong buy, but the actual price movement may be a fall.
As such, it’s always best to employ a mix of TA and fundamental analysis when making investment decisions. The same probably applies when trying to figure the outcome of football matches.
Subscribe to Newsletter
Subscribe to SIAS Mailing List and get updates to all upcoming events and news
By clicking submit, you agree to our privacy statement, collection, use and/or disclosure of your personal data to the extent necessary to provide you with this service.